

Description
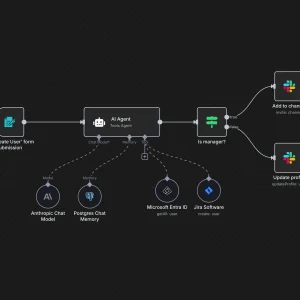
The Self-Service SLA Dashboard gives clients a real-time view of service performance metrics, resource usage, and issue resolution trends—drastically improving transparency, trust, and client satisfaction. Built with visualization tools like Power BI, Grafana, or Chart.js and connected via REST APIs to your ITSM, monitoring, or CRM platforms, these dashboards display key SLA indicators: average response/resolution times, uptime/downtime tracking, ticket volumes, resolution SLA adherence, and project delivery timelines. Users can filter data by date, region, product line, or ticket priority. Clients access this via secure portals with permission-based visibility. Admins can customize dashboard themes, schedule email reports, or embed widgets into client portals. For managed service providers, we enable dynamic billing widgets, usage overage notifications, and contract renewal timelines. This setup reduces manual SLA report generation, enhances credibility, and positions your brand as transparent and performance-driven—especially valuable in enterprise IT, SaaS delivery, and consulting engagements with tight SLAs.


Halima –
The self-service SLA dashboard has been a fantastic addition to the services we receive. It provides a clear and concise overview of our service usage and performance, allowing us to proactively manage our resources and understand exactly how we’re tracking against our SLAs. This transparency has significantly reduced the need to constantly reach out for updates and has empowered us to make more informed decisions.
Jonathan –
The self-service SLA dashboard has been a fantastic addition to the services we receive. The increased transparency regarding uptime, ticket resolution times, and overall service performance has empowered us to better understand the value we are getting. Monitoring our usage and project KPIs has also become much easier, saving our team time and enabling us to proactively address potential issues. This has significantly reduced our reliance on support requests, freeing up both our time and theirs.
Ukamaka –
The self-service SLA dashboard has been a fantastic addition. It provides clear, real-time visibility into our IT performance metrics, allowing us to proactively address any potential issues and better understand our resource utilization. The transparency offered has significantly reduced the need for status update requests and fostered a stronger sense of trust in the partnership.
Asabe –
The self-service SLA dashboard has been invaluable for our operations. It provides clear, real-time visibility into our service performance, allowing us to proactively address potential issues and understand exactly how we’re tracking against our agreed upon service levels. The improved transparency has fostered greater trust and has noticeably decreased the need for frequent status update requests, freeing up valuable time for both our team and the IT provider’s support staff.